This is a small excerpt from my suggestions list to improve Capitalism Lab that I made half a year ago or so.
UI
>
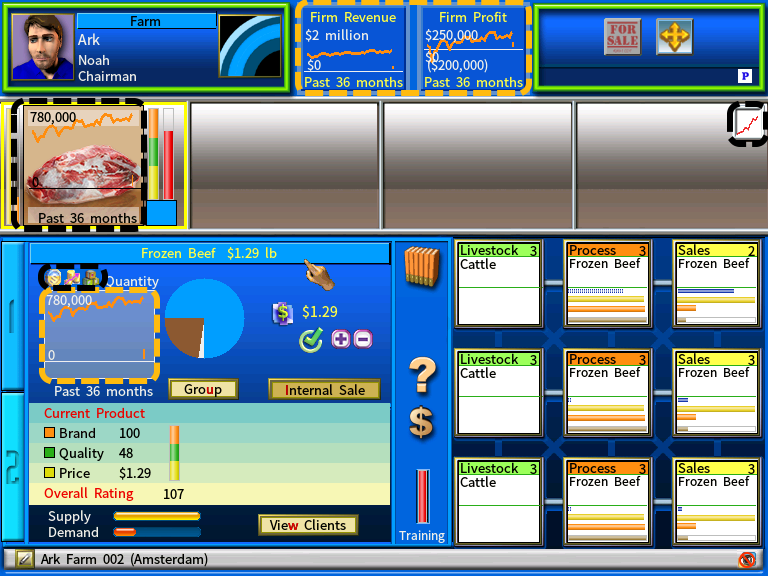
(Orange Highlights) The Firm Revenue and Firm Profit Boxes at the top when directly viewing a firm are not very accurate or I should say ... are terribly inaccurate. It works fine for the first million, where it will report accurately up to $10,000 increments in how much max revenue/profit/quantity was made over the past 36 months but once you hit 1 million it goes off the rails and shows 2 million right away as a number for performance even if you are only making $1,002,701 (one Million and one dollar) as in the example image and completely loses practical accuracy until you get into the large numbers of millions again.
>
(Orange Highlights) Give us at least up to 2 decimals of indication here how much was actually generated in profit/revenue/quantity, something like 2,17m in revenue/profit (if it was $2,170,000), rather than rounding it up to 2 million in the graph as is now the case. To make more room in this box, I recommend using 'm' for Million and 'k' to denote thousands. so $250k profit (instead of showing $250,000) and ''m'' when it's something like 2.17m in revenue for ease and to reserve space in the panel for the next improvement point.
>
(Orange Highlights) These boxes depicting historical numbers in general are somewhat ineffective at representing how the business is performing right now, which is much more critical to the player, they only report the maximum and minimum profit/loss made over the past 36 months, I want to know accurately at a glance how much it was making LAST month, not how much it made 3 years ago at its peak point ... I recommend the box shows three numbers, the top left number should mark the maximum profit/revenue/quantity and the bottom left the maximum losses made over 36 months (as it is now) but add a third number to the top/bottom right of the box and it should show last months effective numbers. This will make it much easier to instantly see at a glance how a business is performing and what its best/worst was in the past 36 months. (place last months performance at the bottom right if it is a positive number, so it doesn't overlap with the graph line itself, and place it at the top right if it was a negative, so it doesn't overlap with the graph line if it was a negative number. That's just my recommendation though.)
>
(Black Highlights) Update the product sale graph button (right black highlighted element) in how numbers are depicted and allow it to show profit/revenue numbers instead ofonly quantity depending on which view you have selected in the graph viewer (left black highlighted elements). Right now pressing this button only gives you quantity numbers when profit and revenue may also be useful to see for all products simultaneously using this tool. It's a little useless right now but could be made much more beneficial to get instant overviews of how your products are actually performing across the board.
See this example image to see what elements of the UI where just discussed.

- ThisIsNot2Million.png (127.16 KiB) Viewed 18460 times
This firm actually only made $1,002,701 in revenue last month but the firm revenue box is telling me it made 2 million at its peak. I know the graph shows it's only halfway to the top where it would actually be two million but that's not user friendly because I have to eye ball the damn graph to see what the actual number is when the number listed should just instantly tell me right away what the actual performance was. This saves me time from having to press the firm financial view every time and see the accurate number placed there. Ironically you can see the actual profit a retail firm made last month outside of the firm viewer or the financial view on the city map if you hover over it OR if you have the ''Firm Information Display Mode'' activated it will show the performance for all businesses but this ONLY works for some firms like retail and not for factories/mines/software/etc WHY?! Why where these left out? It makes no sense. If I hover over my factory or other firms, I want to know how they performed just like any retail firm!
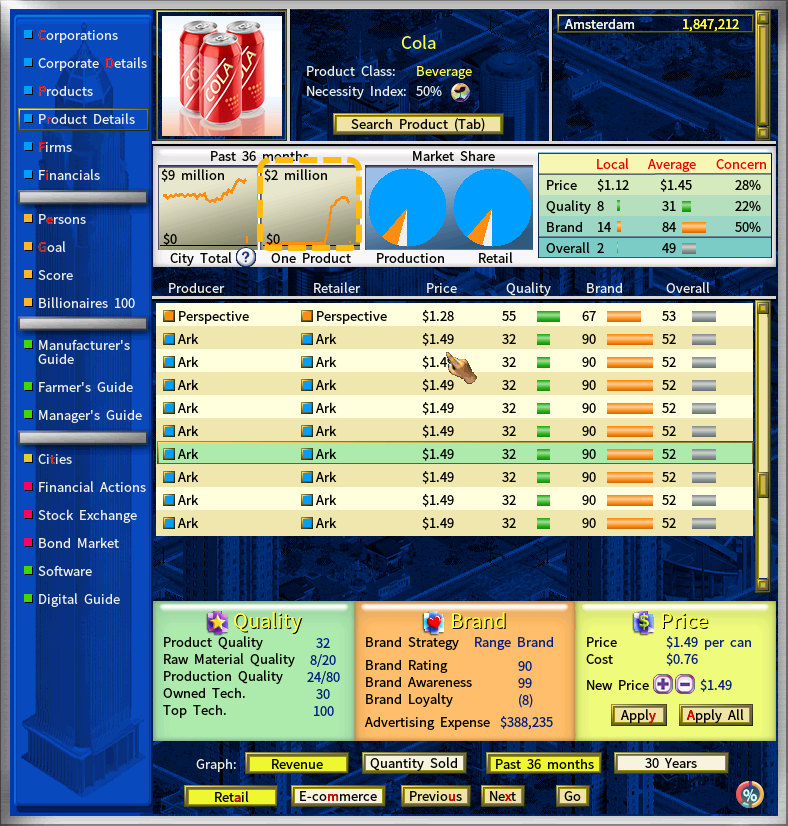
> Almost all profit/revenue/quantity boxes displayed in the information center and elsewhere are incredibly inaccurate because they show the maximum/minimum results of the past 36 months rather than last months results which are much more important to the player. I recommend the same treatment as with the previous UI points. Add an extra number to the right of the box to show last months results (if applicable). Otherwise you have to eyeball most of these things and that's just not accurate enough to me.
> When in the 'Corporate Details' section of the information center, it would be immensely appreciated if the 'Product' and 'Product (Tech)' sections could be sorted (possibly with a tab button) or by default by product class for ease of use and oversight.
> You can toggle between results from the last 36 months and 30 years in the information center ... where's my option for the last 10 years though?

That option is MUCH more useful than the last 30 years since that is really a late game option which many people probably won't even get too due to slowdown on potato machines lol. Adding an option for 10 years would be greatly appreciated for the early-mid game in which most action takes place and is an accurate and more useful representation of how the business is performing long-term.

- InformationBoxIsNot2Million.png (379.94 KiB) Viewed 18460 times
As you can see here, just as with the previous example image, the information box tells me the number is 2 million but it is closer to 1 million and some unknown integer that I CANNOT know because the box is simply inaccurate in providing information. It's really annoying in how inaccurate it is sometimes.
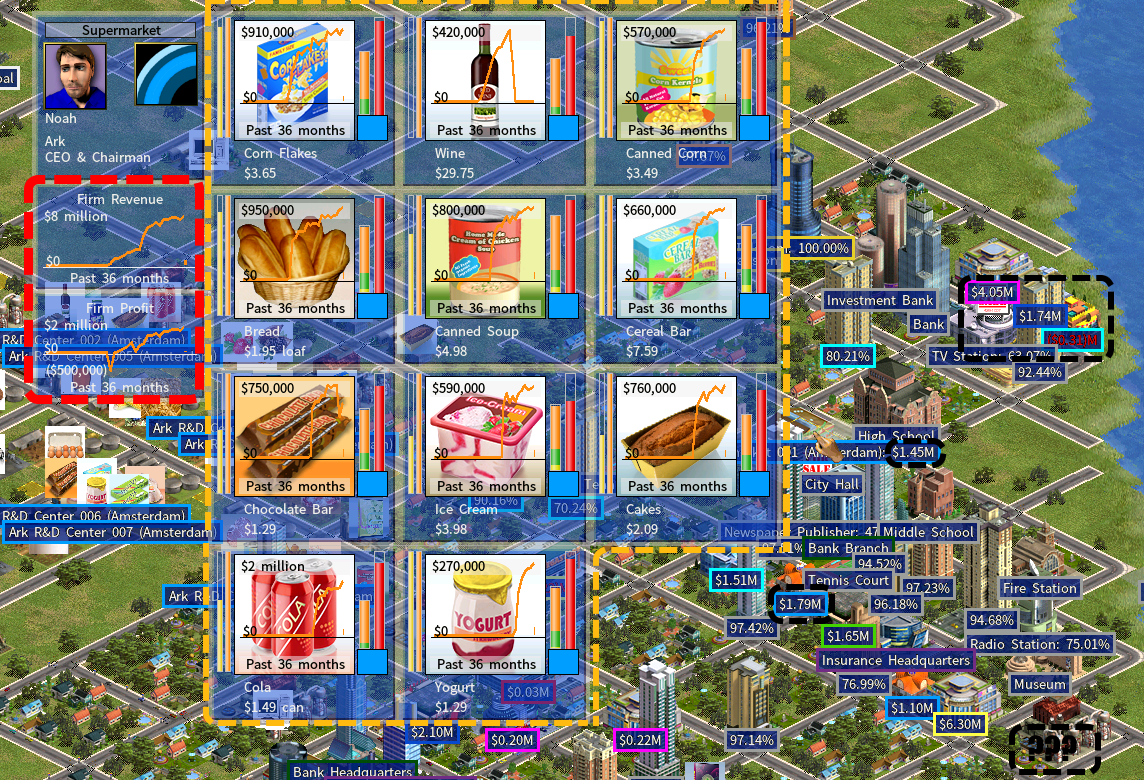
> (Possible UI Feature) Have the products listed while inspecting a firm on the city map also list their profitability (new top right/bottom number) and be sorted from most revenue/profitable to least revenue/profitable. This way a user will have an intuitive feel and fast way to evaluate products and their performance. Right now it is sorted randomly it seems.

- FirmPerformanceCompressed.png (1.52 MiB) Viewed 18460 times
Look it's nice that it is showing me revenue of all my individual products (Orange Highlights) and all but I don't know how profitable each product is or which one needs replacing. For all I know I might be making boat loads of losses on some of these products but I wouldn't know until I inspect the actual firm and its product line up. The firm boxes to the left of this the Red Highlights where it shows the revenue and profit performance of my firm is just telling me it's 8 million in revenue and 2 million in profit ... yes ... but how much is it exactly? It's actually 1.61 million in profit and not 2 million. That's the same problem as I stated before that the UI suffers from incredibly inaccurate graphs. Also note the black highlighted objects in the image, these are the firm profit performances when using the "Firm Information Display Tool". Look how lovely it is displaying all the results for the retail firms? But why is that poor factory in the bottom right not showing how it is performing? I want my factories to report their performance as well when I hover over it or when I have this firm display mode enabled.
> When selecting/searching for a supplier of a product, the overall rating does not consider the freight charge which can be massively decisive in the actual overall rating when buying. It's probably also a newbie annoyance but even for veterans its annoying to have to do extra math. The freight charge should be added as a component of the price rating. Perhaps split the price bar into 2 elements, a piece of the bar that represents the actual product cost (yellow piece of the bar as is now) and a red part (the freight charge that is added to the bottom/top of that bar) and adjust the overall rating for buying based on that.
> When selecting a supplier, it would be nice if the search function was expanded, options to also sort the list by quality and price would be appreciated. Adding product groups would also be great. So if I typed 'Snacks' and added 'quality' at the end, it would list by highest quality products first, similarly for price, if 'price' is entered, sort by lowest price first. The search function already seems to list products naturally by overall rating and brackets each individual product off in its own piece of the list, which is great but these added terms would make the search function just that more useful.
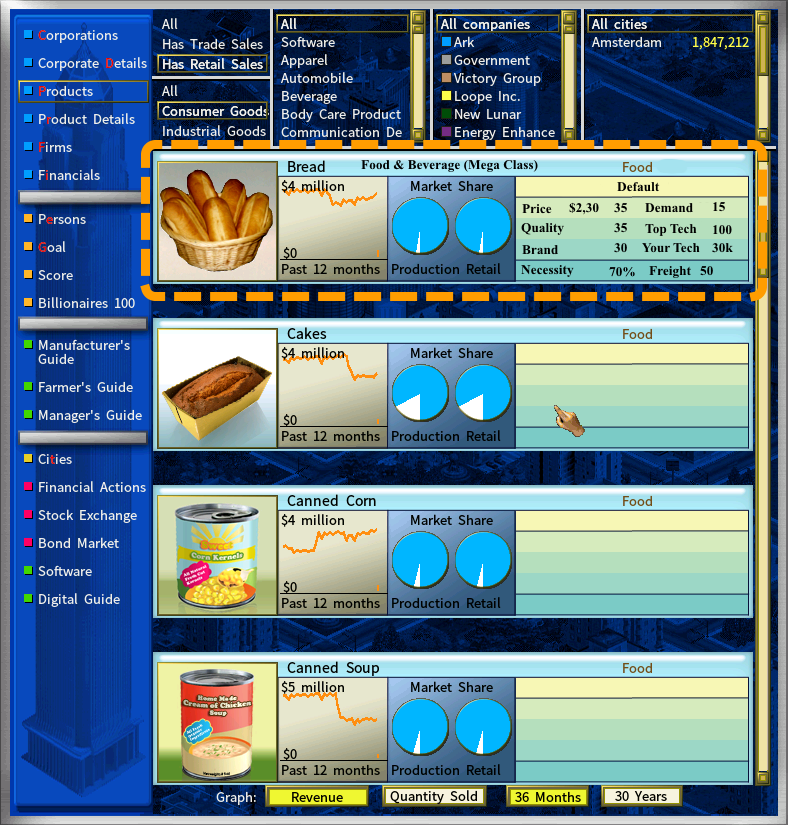
> When in the 'Products' section in the Information center and using the 'All cities' view, there's plenty empty free space that can and should be used to show what mega class the product is part of if applicable, the top tech for this product, your tech, the necessity index and the default numbers for price, demand and the price, quality and brand concern weights as well as the freight index for these products so that a user can quickly see at a glance what is important in a product and what the default price is before city modifiers apply. Right now you need to click on the product to get to the 'product details' to see the actual individual numbers per city but being able to see what the game defaults from the actual files before city modifiers are applied would be useful too as it gives a more general ball park of what to aim for across all cities.
Here's an example of how it could look for the bread product.

- ProductsViewUpdate.png (428.28 KiB) Viewed 18460 times
> The marketshare list of competitors should be ordered by market dominance rather than company order so that the list is from highest to lowest in terms of competitor threat. Right now it is a pain to have to sort it out mentally who your biggest competitor is, you should be able to see this at a glance without having to check each individual competitors marketshare numbers and figuring out your position inside of that. (Possibly place your company NOT by default at the top of the list but in the same way AI's are placed in this list so if you're not at the top you will instantly know by not being listed as #1 in the list that you are NOT in the lead. Instead highlight your company with a special colored bar so you can see at a glance where your company is in the line up. This will make it easy to find your place in the marketshare battle)
> Add another marketshare toggle for retail marketshare rather than only show the manufacturing/production marketshare. This is especially useful if you want to play the retail game. Only showing production marketshare in the marketshare box is quite limited. An option to toggle between the two would be very much appreciated.
> When viewing 'Software' in the Information center under the 'OS Info' tab, it would be nice to see a market share percentage indicator after the ''Userbase'' number displayed for the respective OS.
> When viewing 'Software' in the Information center under the 'Products running on (insert OS)' tab, it would be nice to see a userbase number and a market share percentage indicator after the userbase number displayed for the respective software product. Marketshare listed here should be based on the marketshare of the app running for that particular OS and not the global marketshare which should be listed in the manufacturing guide instead.
> A marketshare number for the hardware devices to show their respective marketshares of devices would be appreciated as well.
> When viewing the 'Digital Guide' in the Information center and when viewing a certain software/internet product, there should be a side panel showing the market shares of the individual products on the right side similar to how there is one for these products in the manufacturers guide. It just makes more intuitive sense that it is actually represented here. Since this is where you go to find out what inputs you need to produce the software/internet similar to how you'd go to the manufacturing guide to see what inputs you'd need for regular products. Also there is no easy way to check for internet product marketshares currently (as it does not exist in the manufacturing guide) so this would be greatly beneficial for this product group in particular to be listed here. I don't like having to go through all my internet competitors to see what actual market shares they have by doing basic math for each company ... I actually have to get the pen and paper out to do this ...
> When viewing the ''Digital Guide'' add an extra tab for 'Telecom Guide' which lists the relevant information regarding telecom services, prices, subscriptions, marketshare, (I will expand on this tab more in the future in the digital age DLC forum as a way to improve the telecom game.)
> When Setting up a new subsidiary company, it would be beneficial if the user could also use the new and improved interface to select a corporate color and corporate logo as is used when starting the game. It is sadly still using the old interface system.
> You cannot change the name, color or logo of your own company while it is easy to do so for your subsidiaries ... why not allow us this functionality for our own corporation as well?
> bring back the blue selection box when building a firm over unoccupied land. Currently it is no longer functioning as it did in capitalism 2. It was just a nice Quality of Life feature.
> When Headhunting for new talent, the interface will sometimes switch up the actual tech pool that you were headhunting/hiring from last and you will end up miss clicking and messing up your tech R&D. This is another QoL feature I'd highly appreciate.
> When viewing 'Firm Financials', it would be nice if some of the critical Firm Balance information was also given aside the Income statement for the particular firm in question if applicable. Such as 'Inventory', 'Business Assets', 'Land and Resources'.
> In the 'Bond Market' section of the information center, it would be great if you could search for your own 'Issued' bonds with a simple tab press. This is incredibly useful if you want to buy back your own bonds and don't want to slog through all the other corporate bonds floating out in the market. I just want an easy list of all the bonds that I have in the market and see which ones I need to buy back.
> In the 'Financial Actions' section under the 'Issue New Bonds' you can see which bonds you have already issued. It would be great if you could double click on them and get sent to the Bond Market and have the bond in question pre-selected so you can easily buy back the bond. Just more QoL.
Phew I finally made it through most of my list on UI improvements. I only have a small bit left about Pie charts and eCommerce but I'll post that another day. I hope everyone survived reading all that. Let me know if there was anything which I wasn't clear on or which you disagree with. I'd love to hear some feedback on these things. I think most of these things are really necessary to offer a lot of Quality of Life improvements for players. Thank you for reading and being so involved with the community. Much love and kindness.
